
About this site
HOME PAGETechnology
80 COLUMN CARDS PRIVACY DISCLOSURE BYOD EYE-FI RASPBERRY PI ARDUINO ESP8266 PROGRAMMING MISSILESManufacturing
GRADUAL DECLINE THE FINAL DAY MATHER & PLATT TRAFFORD PARK 25 YEARS AT GEC GEC HISTORY MICROMETER HEAVEN METRICATIONEnergy
THE PROBLEM GULF OF MEXICO CARBON CONSCIENCEMy Web Sites
MY DESIGNSMiscellaneous
BOILER MONITOR THE LIBRARY MY KINDLE ODD STUFFLinks
WHISKY GALORE TOURS TELERAMICS THE B5105 TELEGRAPH POLES WORLD WIDE WORDS NGTE PYESTOCKSVG VERSUS PNG
When designing web applications for plotting data there's always the decision about whether to use SVG or PNG. They are very different formats and each have their uses. I prefer to use SVG for on-the-fly graphics for a number of reasons:
- the source file is human-readable and so debugging is usually easy (any difficulties are often a misundertsanding of the SVG command being used)
- during debugging your program can annotate the SVG code and write out important values
- it's often possible to reverse engineer a graph by first writing the SVG by hand to obtain what you want and then coding it into a program
- SVG has animated elements (GIF files could have been used in the past for this purpose but its use is now deprecated)
- the image is scalable without loss of definition
- with a little planning and additional programming you can specify and control many aspects of the image using cascading stylesheets (CSS). This allows you to customise the output without changing the program. See note 1.
However, there are some disadvantages to using SVG. My experience has shown the following to be potentially problematic:
- the quality of the graph can be disappointing, especially text and small elements. You need to refer to the shape-rendering and text-rendering features within SVG's CSS
- the origin (0,0) of the image is, like some other formats, at the top-left of the screen. This means that increasing Y values need to be converted into decreasing screen units
Improving legibility
By default, browsers will not necessarily choose the combination of text and shape rendering options that you would wish to use. While Firefox always displays shapes (defined using <path>) with sharp edges, IE displays them with anti-aliased edges. You will find that creating different CSS classes for each group of shapes that have similar attributes, you can obtain the best results. Rectangular shapes, such as bars on a bar chart, are best rendered with shape-rendering: crispEdges. Circular shapes are best rendered with shape-rendering: geometricPrecision which anti-aliases the shape to create smooth curves.
Notes
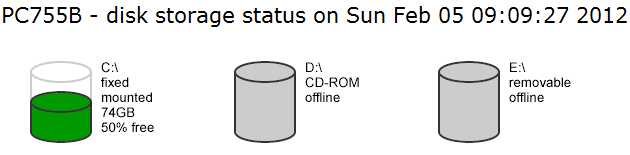
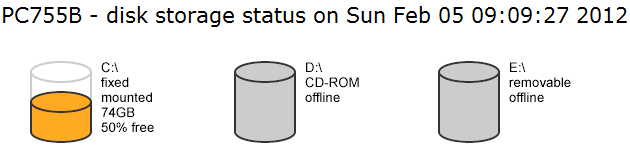
1 - I have a program that determines the size and amount of free space on disk drives and then generates SVG plots for each one with an HTML wrapper. The program colours each image according to the amount of free space available. Different servers have different thresholds for when to worry and while the CGI programs on each are identical, the colours are specified through a local CSS file and a class attribute. This practical example demonstrates how bespoke programs can be avoided by using local versions of customer-controlled CSS files. The first image shows one image with green as the 50% or less indicator and the second with a different CSS file.