

About this site
HOME PAGETechnology
80 COLUMN CARDS PRIVACY DISCLOSURE BYOD EYE-FI RASPBERRY PI ARDUINO ESP8266 PROGRAMMING MISSILESManufacturing
GRADUAL DECLINE THE FINAL DAY MATHER & PLATT TRAFFORD PARK 25 YEARS AT GEC GEC HISTORY MICROMETER HEAVEN METRICATIONEnergy
THE PROBLEM GULF OF MEXICO CARBON CONSCIENCEMy Web Sites
MY DESIGNSMiscellaneous
BOILER MONITOR THE LIBRARY MY KINDLE ODD STUFFLinks
WHISKY GALORE TOURS TELERAMICS THE B5105 TELEGRAPH POLES WORLD WIDE WORDS NGTE PYESTOCKBOILER MONITOR
The up-to-date boiler monitor is here. For the history behind it, please read on below.
My old oil-fired central heating boiler was circa 1974 vintage and the ignitor was becoming intermittent, which meant that if it didn't light, it tripped out. I spoke to Nu-Way who manufactured the burner unit and they said something unpublishable and "...that should be in a museum!". With little hope of repair it looked like a new boiler was inevitable. I did do some research into alternative heating systems but they were either expensive (ground-source heat pump, electrical heating), impractical (wood pellets) or would probably contravene local planning (PV panels) as I live in a Conservation Area. After a period of investigating boiler manufacturers and installers, I finally settled on a 32/50 (kW) oil-fired boiler by Worcester Bosch. This was installed in a day and while not costing any less to run, despite it being 93% efficient, it does heat the house very quickly and to a temperature higher than the old boiler ever could.
The boiler is located in a building that's separate from the house and I was intrigued to determine how long the boiler was firing and also when the house thermostat had cut in. I bought a Velleman USB I/O card and some mains relays from Maplin, wrote a couple of Windows programs in C, found a spare Dell GX11 PC in my store and very quickly had a working boiler monitor. One program runs continuously, collecting data from the I/O card and writing it to disk - this is explained in more detail later. The second program runs as a CGI program within IIS and generates HTML and an embedded SVG image from the collected data. The graph below shows a typical day's usage.
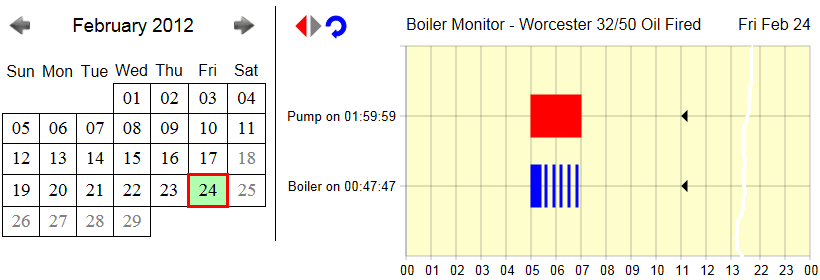
The graph is generated on-the-fly and shows the "on" and "off" periods for each channel that it's monitoring. Two channels are being monitored here
but the card will support up to five digital inputs. I built a unit that sits between the card and the mains supplies for the pump and boiler.
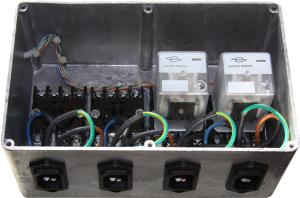 This
is limited to four channels but only because that's as many relays as would fit the die-cast box. The photograph here shows the internal
arrangement with two relays removed. You could use a third channel to monitor the mains supply,
providing the PC was on a UPS.
The image contains three icons that are links to the previous and next day's data and a refresh button for the current day. The icons change colour
with the context, so if there is no previous or next day's data, those icons
are grey and inactive. A calendar is also generated and shows, by default, the current month. You can click on a day to view its graph.
This
is limited to four channels but only because that's as many relays as would fit the die-cast box. The photograph here shows the internal
arrangement with two relays removed. You could use a third channel to monitor the mains supply,
providing the PC was on a UPS.
The image contains three icons that are links to the previous and next day's data and a refresh button for the current day. The icons change colour
with the context, so if there is no previous or next day's data, those icons
are grey and inactive. A calendar is also generated and shows, by default, the current month. You can click on a day to view its graph.
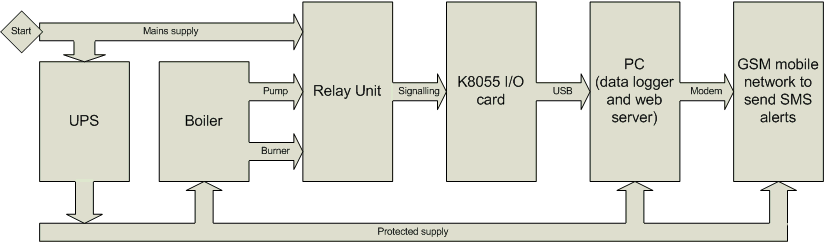
The block diagram below shows the general design of the system. A UPS provides reliable power to both the boiler, pump and PC so that power failures can trigger an SMS message to one or more mobile or fixed numbers.
SVG is a standard web language for graphical images and it has the benefit of being human-readable, which is an essential aid during development and debugging. Most modern browsers will deal with SVG, though if you're using Internet Explorer you might need to install the Adobe SVGview plug-in. (Why I use SVG.)
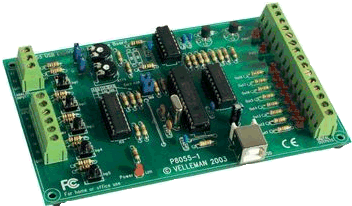
The Velleman card is very easy to set up and get going. There's lots of example code in Basic, VB, C++ and so on on the Internet but none that I could find for standard C, my preferred language. This was a potential problem because the card is supplied with a DLL but no .LIB file, so my C linker was going to complain about that.
The purpose of the LIB file is to provide information to the linker about the functions in the corresponding DLL. The linker would normally include this information in the program's EXE file. In the end I used pointers to each function that I intended to call and resolved the addresses of their locations at run-time, so the linker did not need to know about the functions at link time. There are four steps to obtaining the functions' addresses:
- create a type definition for each unique function type, that is, its return type and argument types
- using the type definition, define pointers to each function using its name. The name you choose to use doesn't have to match the actual name of the function in the DLL, but not doing so can cause confusion and is poor practice.
- load the DLL by specifying its path and filename in a call to LoadLibrary()
- obtain the address of each function in the DLL and assign it to the local name
The following example code in C shows the various steps involved:
// One typedef for each unique combination of return and argument types
typedef void (CALLBACK* LPFNDLLFUNC0)(void);
.
.
// Define each function using its corresponding typedef
LPFNDLLFUNC0 ReadAllDigital;
.
.
// Load the DLL
hDLL = LoadLibrary("K8055D.dll");
.
.
// Store a pointer to the address in the DLL of the function
ReadAllDigital = (LPFNDLLFUNC0)GetProcAddress(hDLL,"ReadAllDigital");
.
// Now you can use the function by calling it as ReadAllDigital()
THE DATA RECORDING PROGRAM
The coil of each 240VAC relay is connected in parallel with the burner's and pump's mains supplies so that when the burner and pump are running the corresponding relay coils are energised. The NO (normally open) contacts of each relay are connected to the corresponding digital input so that when the relay coil is energised the contacts close and the I/O card detects a 1 on that channel. The data recording program (K8055log.EXE) runs continuously and records any changes to the digital inputs. The program only writes a record to the data file when a change occurs and this means that the data files are fairly small and, for this application, less than 2K bytes per day. The filename comprises the date that the data were recorded and each data record is a simple timestamp and the current status of each channel. An example of recorded data is shown below:
00:00:00 0 0 0 0 0
04:59:05 1 1 0 0 0
05:21:49 1 0 0 0 0
05:32:55 1 1 0 0 0
05:38:17 1 0 0 0 0
05:50:37 1 1 0 0 0
05:55:59 1 0 0 0 0
06:08:35 1 1 0 0 0
06:13:55 1 0 0 0 0
K8055log starts by reading a configuration file, which can be used to set up rules for what to do when a channel goes on or off. Typically, this can be used to send a text message to someone about a power failure, etc. All that's required is a mobile handset connected by cable or Bluetooth and to type the port, mobile number and appropriate message in the configuration file.
The program needs to deal with channel settings spanning midnight and this requires synchronising two data files. It does this by checking to see whether the file it is about to write to exists, if yes it just writes the data, if not it writes a record for midnight with the current settings as the first record in the new file before writing the new settings that triggered the write. There is no corresponding midnight record in the previous day's data file but the plotting program deals with this by extending, to midnight, the last data recorded.
THE GRAPH PLOTTING PROGRAM
The graph plotting program (BoilerMonitor.EXE) runs as a CGI program under Microsoft IIS, thjopugh you could use Apache or something similer. With no arguments the program generates a graph for today's data. It reads a configuration file to obtain some parameters such as its own URL, the path to the local data files, how many channels to display, plot style options and whether to draw graphpaper.
The program draws the axes, labels and graph paper; then it reads the data file and generates the "ON" graph for each channel. It then determines whether the previous and next day's files exist and creates the icons and links if appropriate.
The program also inserts comments into the SVG so that human readers can keep track of what is being drawn. One of the settings in the configuration file is to create additional diagnostic comments in the SVG source to assist in debugging future revisions of the program.
Browser Compatibility
The original CGI program did not create the calendar and just generated an SVG file for the graph. Creating a combined HTML (for the calendar) and SVG file requires the latest browser versions to avoid using <object> or <embed> tags which are not supported consistently in all browsers. Firefox, Internet Explorer 9, Google Chrome, Opera, and Safari all support SVG code inside the HTML code.
PARTS LIST
The list of parts required is shown in the table below. The Velleman I/O card comes with its own USB cable. I have used RJ45 sockets and a patch cable for the connection between the I/O card and the relays so that I can put the PC remote from the boiler, but you could make a direct connection or put the card and relays in a larger die cast box and have just a USB connection to that.
The connections between the mains inputs and the relays are single core 1mm2 stranded cable terminating at screw terminals at the relay but could be soldered or crimped spade connections at the IEC socket. The internal cabling is bound together with some small plastic tie-wraps.
| Description | Quantity | RS part number | Maplin part number |
|---|---|---|---|
| Die-cast box 120x185x80 | 1 | N72FK | |
| 240V relay - 8-pin | 4 | JG60Q | |
| Relay socket - 8-pin | 4 | JG54J | |
| IEC C14 mains socket (chassis type) | 4 | HL15R | |
| RJ45 Krone IDC metal receptacle (chassis) type | 1 | 450-9062 | |
| Velleman K8055 card | 1 | L92BL | |
| 3mm nuts, screws, washers | various | ||
| 1mm single core stranded wire | |||
| spade connectors (optional) | |||
| tie wraps |
PHASE 2 NOW COMPLETE
Phase two was to use Dallas (now Maxim) 1-Wire thermometers to record temperatures at various points on the boiler and plot them on the graph with a second Y axis, or as a separate graph. I planned to record outside air temperature and inlet and outlet water temperatures on the boiler. This is now complete and working.
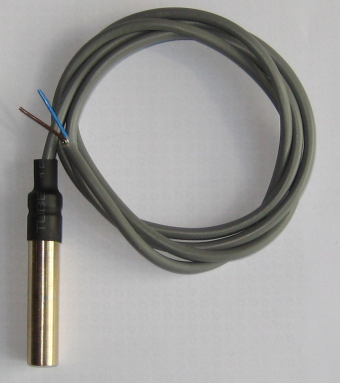
The sensors needed to be fairly robust since they were going to be either unprotected outside or clipped to the boiler pipework. I used Dallas DS1820 sensors and potted them in brass tubes sealed with epoxy. This involved the following steps:
- machining on the lathe to cut, drill and finish the bodies from 8mm brass rod
- soldering the sensors to their leads
- testing the sensors before potting
- assembling the sensors and bodies
- potting the assembly
- fitting some heat-shrink sleeving to further stiffen and protect the cable
- connecting the four sensors together and terminating with an RJ11 plug
- final testing of the whole assembly
With hindsight, it would have been better to use stainless steel rather than brass for the sensor bodies because the one used to measure the flue gas temperature succumbed to stress corrosion cracking, which allowed moisture to leak into the body and cause intermittent problems. I made a new body in stainless steel and there have been no problems since.
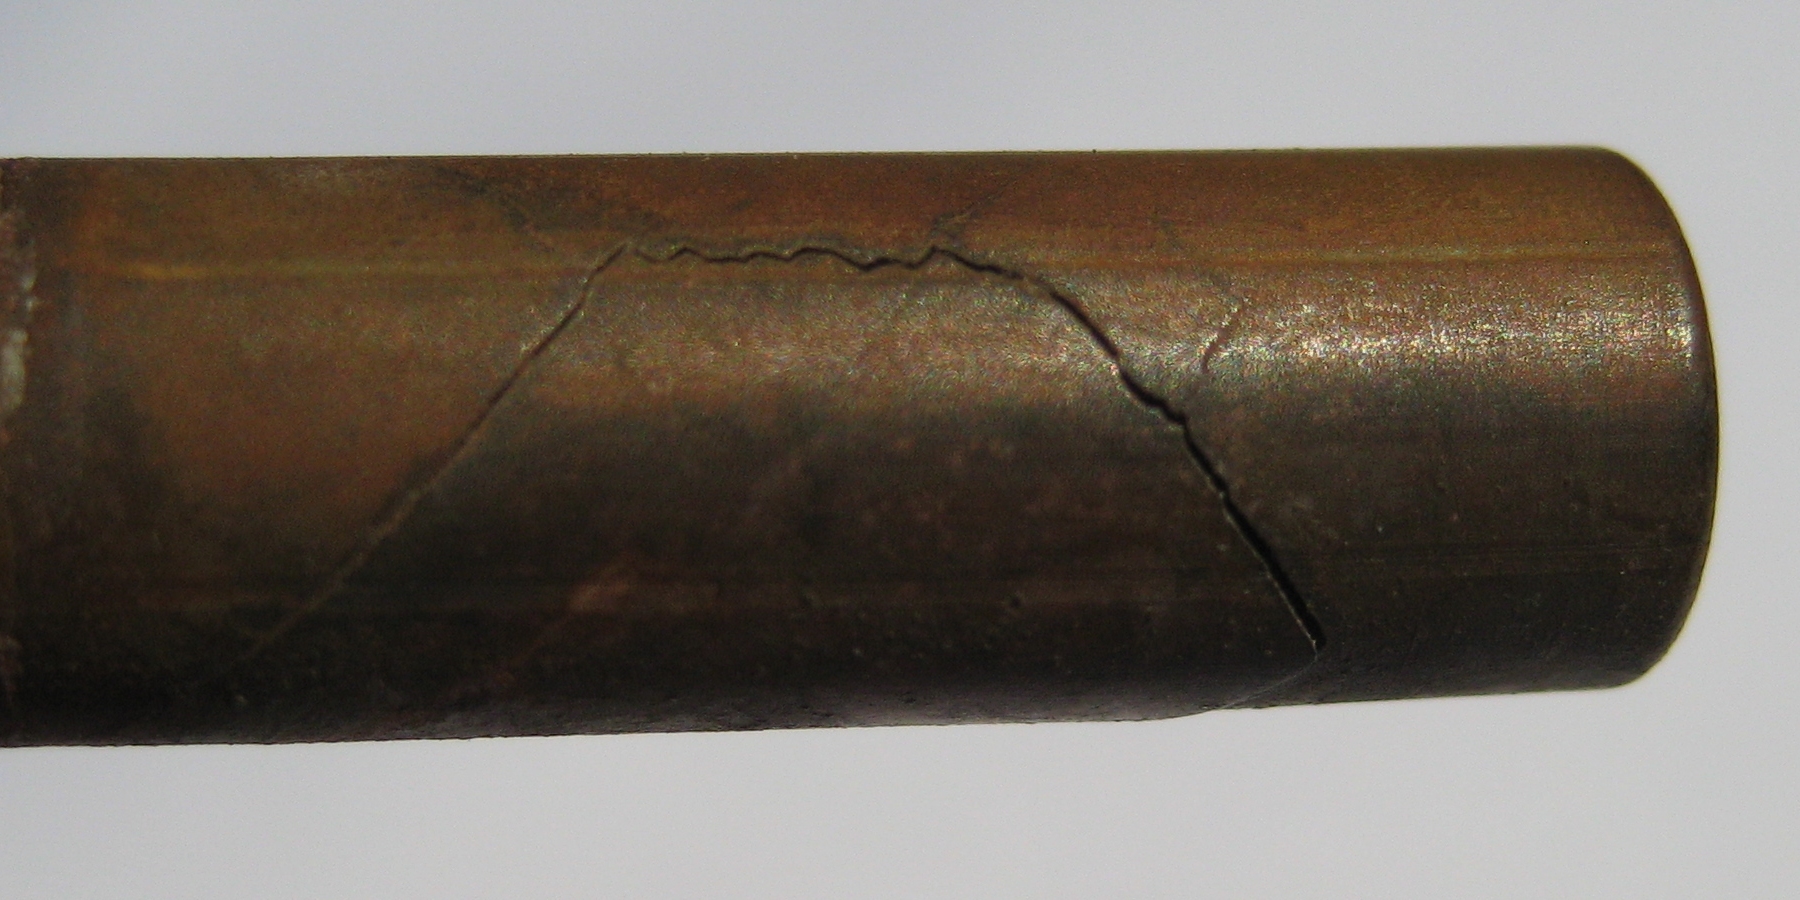
The photograph here shows the crack that appeared. Stress corrosion cracking is more prevalent in alloys than in pure metals and it can be caused when susceptible materials with residual internal stresses (due to manufacturing, cold rolling, etc.) are exposed to even mildly corrosive environments. Since my brass sensor body was placed in the stream of flue gas, I presume that the acidic nature of the vapour was the cause. The acidic condensate, which is a combination of sulphurous and sulphuric acids, is produced when small amounts of sulphur in the fuel oil are burnt. The condensate has a pH that ranges from 3-5. Current legislation (since January 1st 2008) means that all kerosene must contain less than 0.1% sulphur (1000ppm).
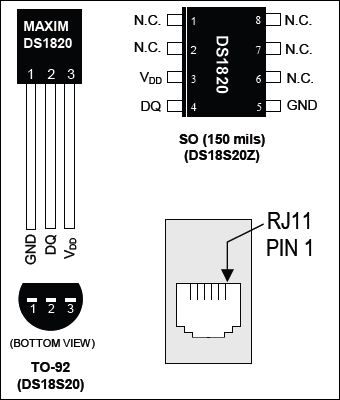
I used the TO-92 versions of the DS1820 sensors because they are much easier to solder than the surface mount version. I wanted to use parasite power, which avoids any external power supply and instead uses power from the data network itself to drive the circuit. To do this you need to connect the GND and VDD pins. These then connect to pin 4 on the RJ11 plug and DQ connects to pin 3. There are two ways to connect the sensors to a PC:
- DS9097U - 9- or 25-pin serial connection (there are several variants)
- DS9490R - USB adapter (the 'B' variant accepts an i-Button)
On previous projects, I have successfully used the DS1820s fitted into the circular sleeve of crimp tags. These could be fixed under any convenient nut or bolt to measure the temperature of the machine. Alternatively, you could machine a flat on the brass body, or use square section rod, to obtain better thermal conduction.
The image below shows the graphs of four temperature sensors. The program that records the data was one that I written back in 2001 and it was just a matter of copying it to the boiler monitor PC and modifying its configuration file to include the unique ids of the new sensors. The program runs continuously and records temperatures every 5 minutes. The program that created the original graph was modified to also read and plot the temperature data.
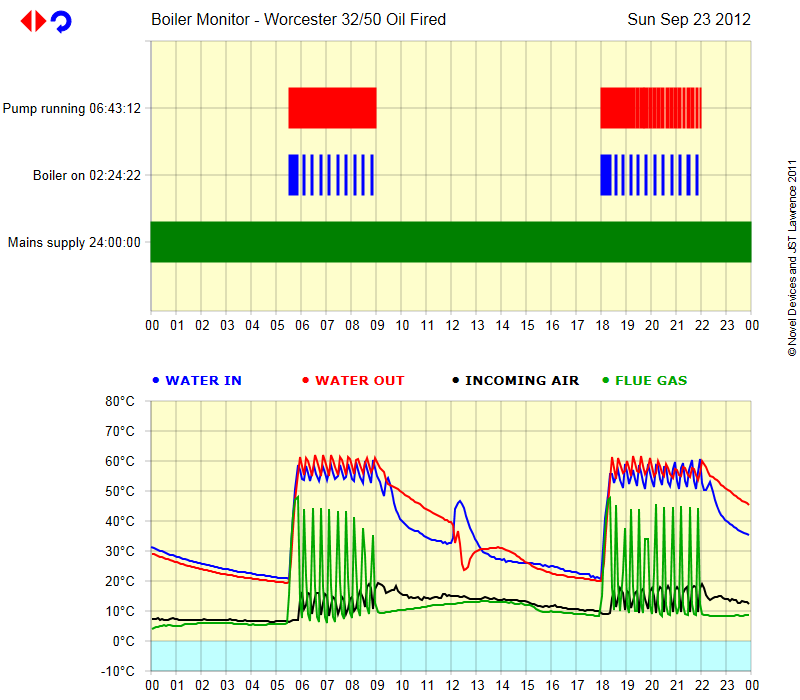
The graph shows some peculiar activity in the system when the heating is off. It appears that convection currents can cause the water to suddenly move around the pipework.
REMOTE CONTROL
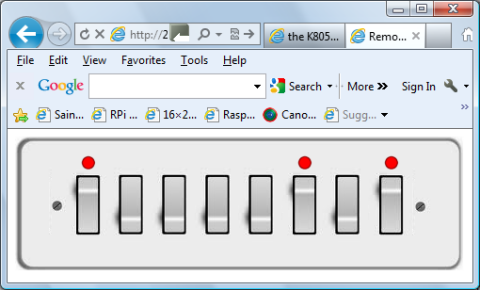
The Velleman K8055 USB interface board has 8 digital outputs (up to 50V 100mA each but 500mA aggregate) that can be used to control external devices such as relays. I have written a separate program that controls these outputs via a web interface. When you connecting to the server, it reads the current status of the outputs from a configuration file and then composes the HTML to display an appropriate image in the browser. You can then switch on or off any of the 8 outputs by clicking on the corresponding switch. The server processes the request, send the appropriate commands to the K8055, saves the settings and then redisplays the webpage. The web server uses up to four images to make up the final image: left hand side, right hand side, switch off and switch on. You could of course change the images to show MCBs, antique switches, slider switches, etc.
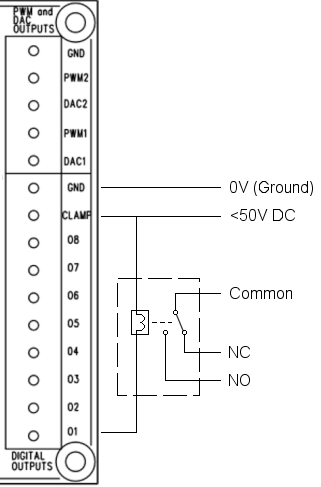
Now that this is complete, I plan to connect an output channel to a relay and then the boiler circuitry so that I can switch the system on and off remotely. I would typically use this when the system would normally be off and I was coming home early. The connections and circuit are shown here. Clearly, you need to match the voltage of the power supply to the requirements of the relay.
NEXT STEPS
With the launch of the Raspberry Pi, I plan to convert the data collection and presentation programs to run on that instead. This will reduce energy consumption by eliminating the Dell PC and will make it possible to put everything in a single die-cast box. Here's what I am doing with my Pi.